
Reports
BeanHub builds reports from the same entries as the journal. They only include files loaded through main.bean. Date filters in the header apply here too. The screenshots are the public example book.
Balance sheet
Section titled “Balance sheet”Balance Sheet shows Assets and Liabilities (and related buckets the UI groups on that page) plus a step-area chart of balances over time.
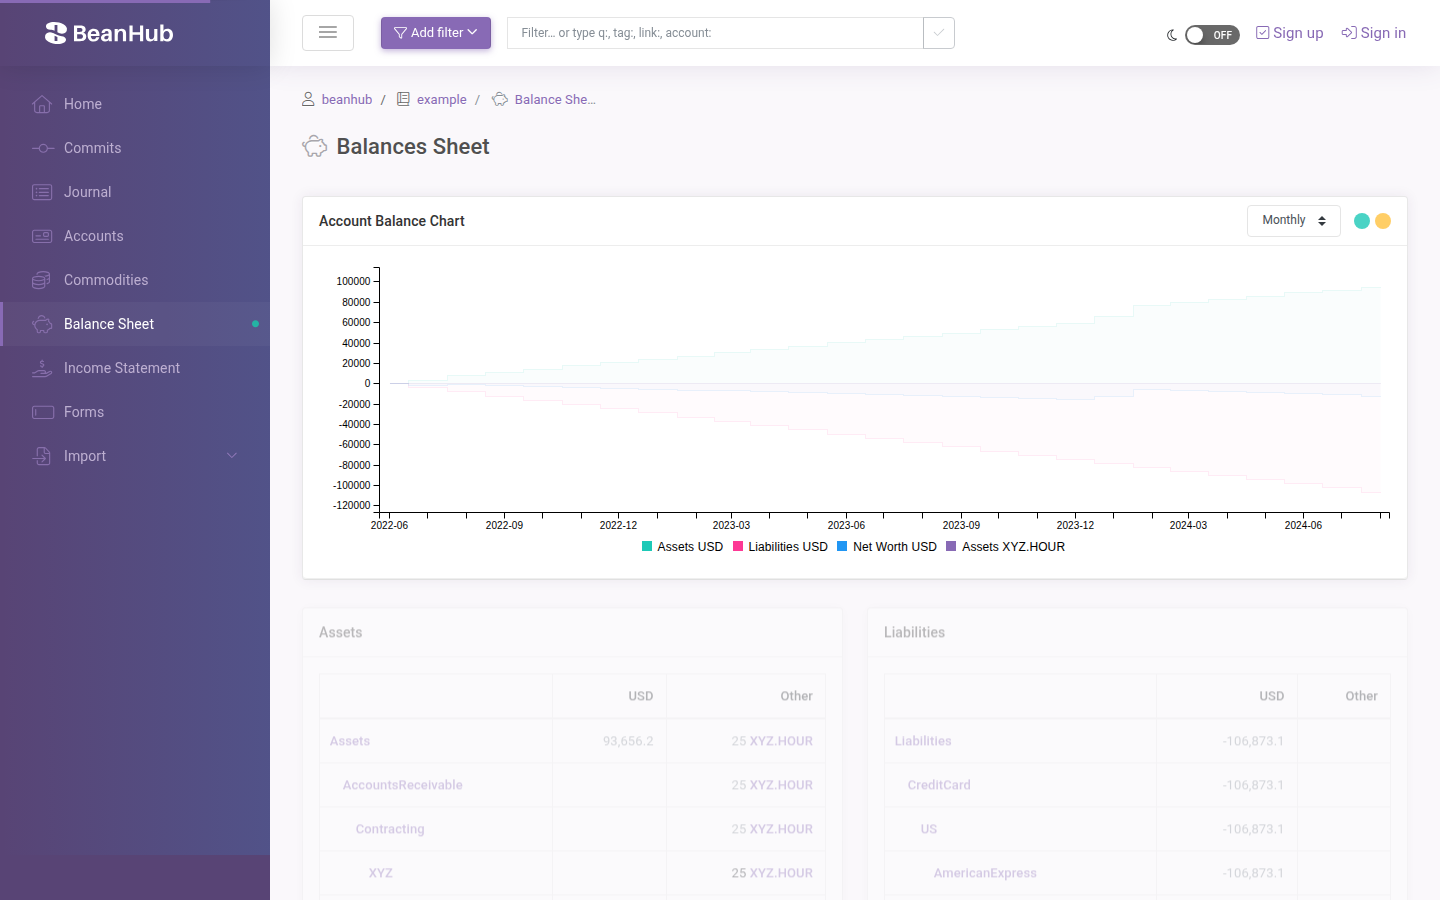
Use the interval control on the chart toolbar to change how points are grouped.
Read a balance sheet as “what we have and what we owe” at the filtered dates. In Beancount, liability balances are often negative. The Academy accounts chapter is the primer if the signs look backwards.
Income statement
Section titled “Income statement”Income Statement charts income and expenses over time as a bar chart, with tables for those account trees.
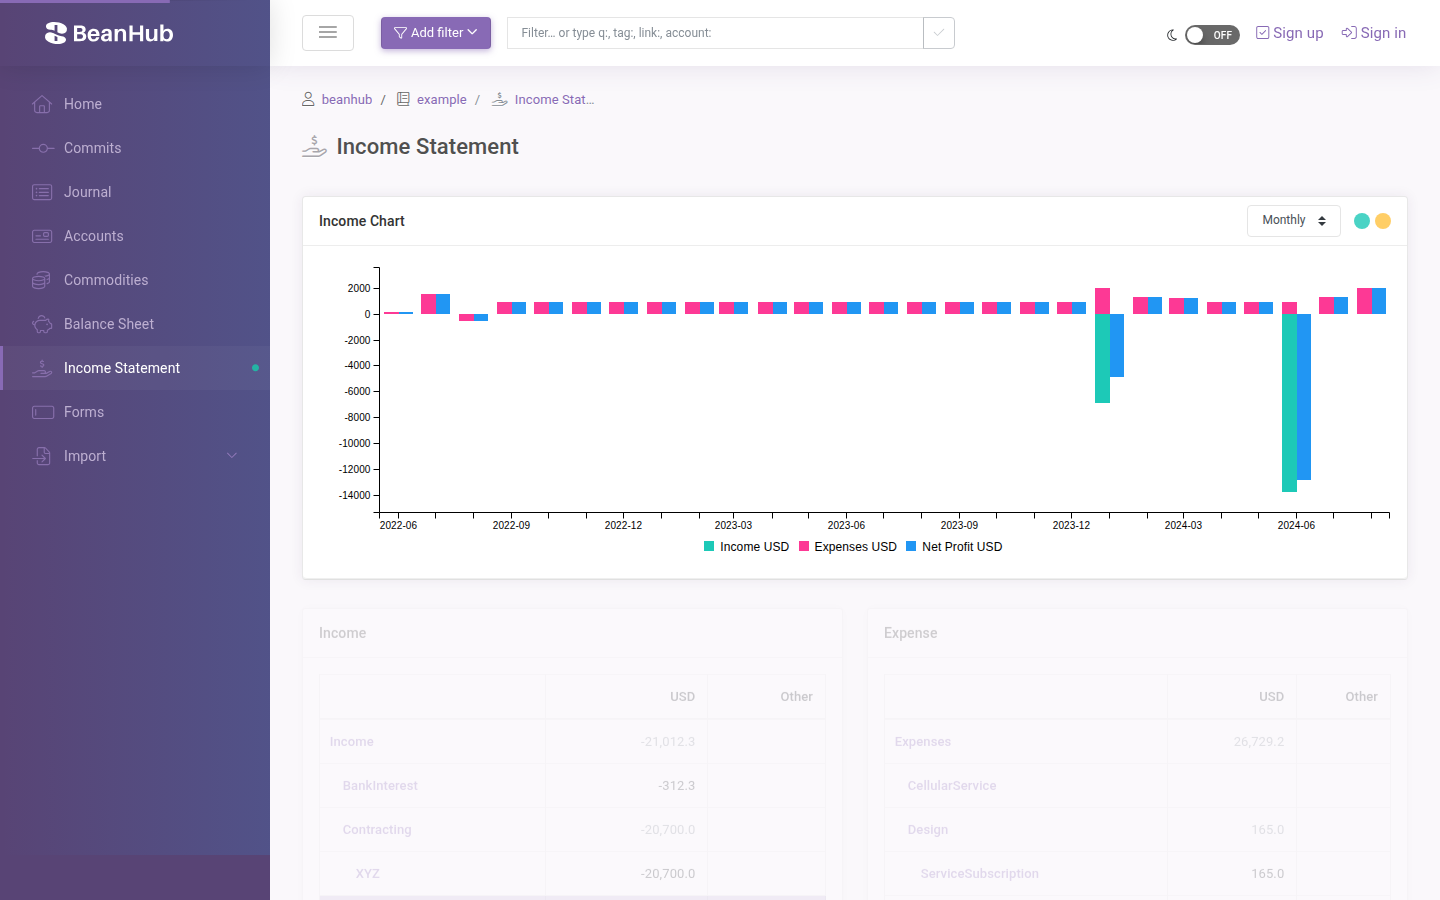
Income amounts are usually negative in the underlying data. The charts are meant to be readable; still, if a number looks flipped, check the journal for the same account.
Filters and empty books
Section titled “Filters and empty books”If the book has no commit yet, these pages show the empty-repository clone instructions instead of charts.
If filters exclude every entry, the charts and tables are empty. Clear the date filter.
There is no separate cash-flow statement in the sidebar today. Use the journal plus account pages for that view, or clone and run local Beancount tools such as Fava.